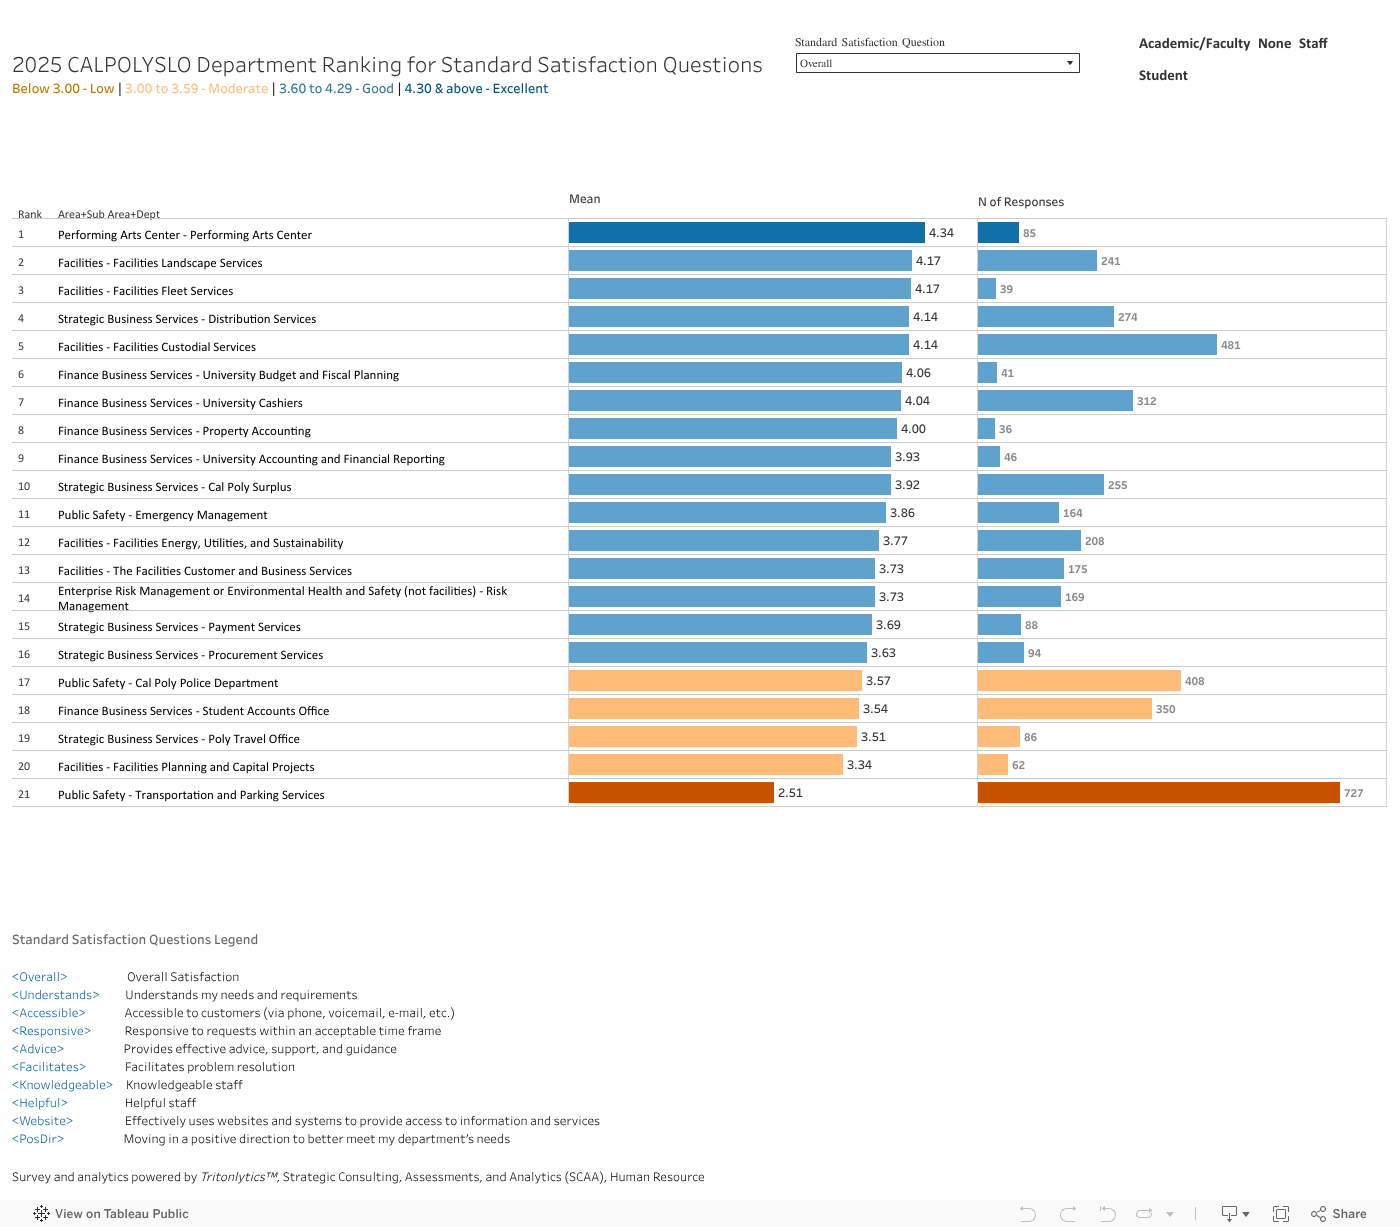
2025 Total Invitations: 25,543
| Students | Staff (incl. CPC/ASI) | Faculty | |
|---|---|---|---|
| Total Invitations | 22,361 | 1,907 | 1,275 |
| Total Respondents | 904 | 228 | 52 |
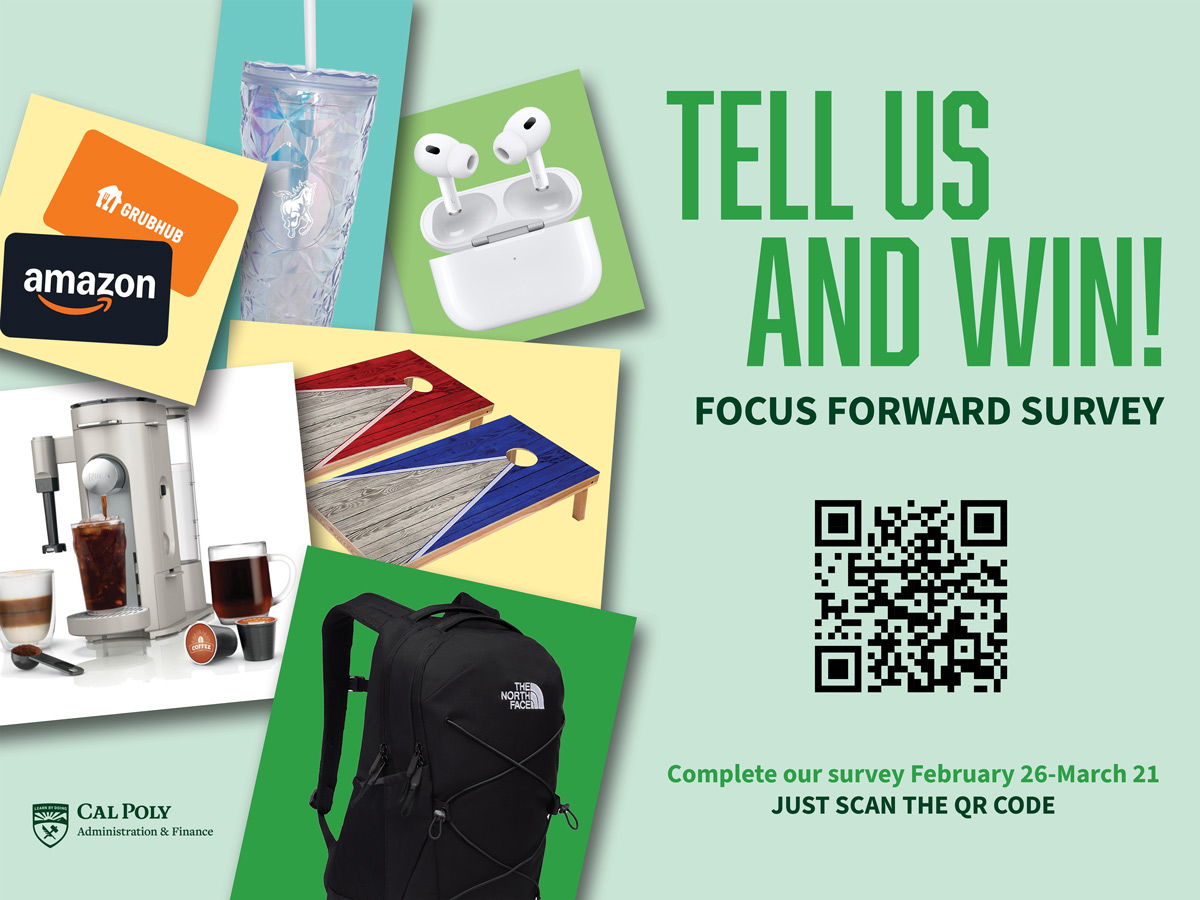
Administration and Finance leadership wants to know how their departments and teams are doing, and starting February 26, the campus community can share their thoughts and experiences during the annual Focus Forward Survey. The survey is open to all faculty, staff and students, and for each survey completed, respondents will receive an entry into a drawing.
This confidential survey is comprehensive, offering individual sections for each unit and department. Campus community members are only being asked to complete the sections relevant to them.
The survey results will help all departments and units fine tune their services and deliverables to further understand customer needs.
To take the survey, click on the following link and then login using single sign-on (SSO):
Open Focus Forward Survey - Survey ClosedFocus Forward is Administration and Finance’s annual Customer Satisfaction Survey. We would like to invite you to share your feedback on our division’s services to the campus community over the past year.
While the survey covers every unit and department within A&F, you are only being asked to complete the sections relevant to you. For every department survey that you complete, you will be entered into a drawing for prizes. More than 40 winners will be selected for prizes including Apple AirPods Pro 2 Wireless Earbuds, Tailgating Pros Lightweight Cornhole Boards, Ninja Pod & Grounds Specialty Single-Serve Coffee Maker, The North Face Jester Backpack, a Cal Poly Tumbler or one of 36 Amazon or Grubhub gift cards.
The survey will be open until midnight on March 21.
| Students | Staff (incl. CPC/ASI) | Faculty | |
|---|---|---|---|
| Total Invitations | 22,361 | 1,907 | 1,275 |
| Total Respondents | 904 | 228 | 52 |
| Trends – All History | 2016 | 2017 | 2019 | 2021 | 2022 | 2023 | 2024 | 2025 |
|---|---|---|---|---|---|---|---|---|
| Total Invites | 17,241 | 17,388 | 23,558 | 23,855 | 24,445 | 25,330 | 26,055 | 25,543 |
| Total Respondents (individuals) | 1,366 | 1,089 | 1,695 | 1,054 | 980 | 929 | 1,247 | 1,184 |
| Percentage of respondents to invitations | 7.92% | 6.26% | 7.00% | 4.40% | 4.00% | 4.00% | 4.80% | 4.40% |
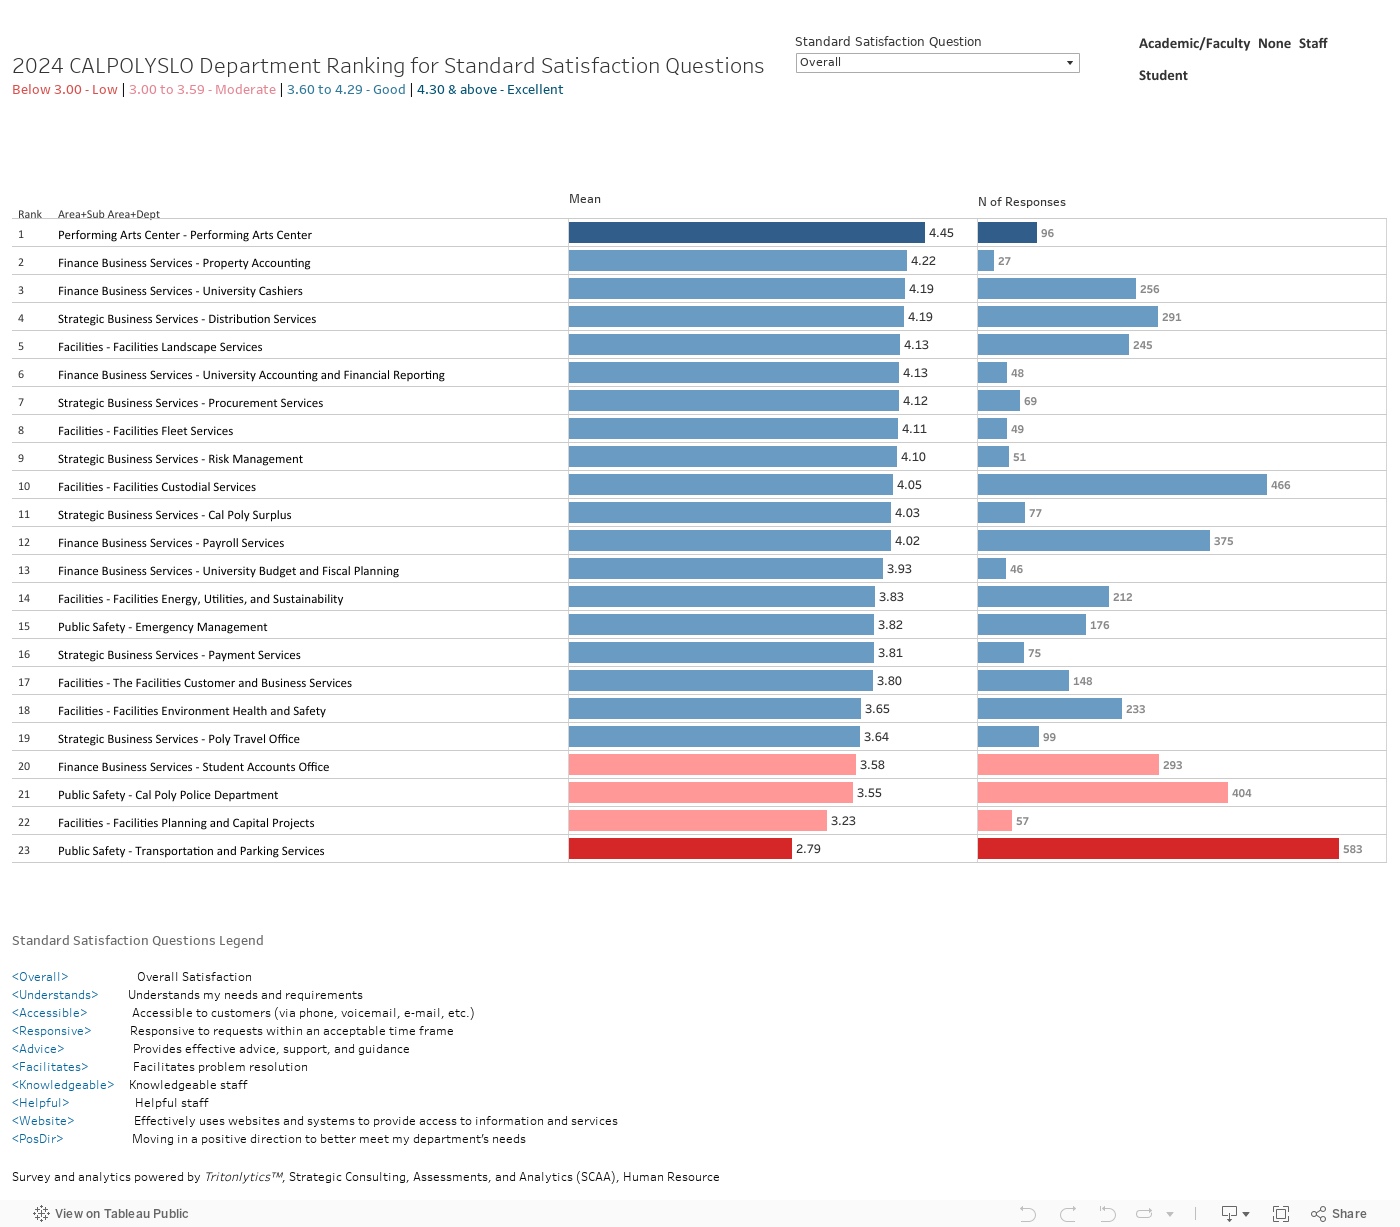
Scores ranging from 2.79 to 4.45 on a 5-point satisfaction scale.
Of the 21 departments surveyed:
| Students | Staff | Faculty | |
|---|---|---|---|
| Total Invitations | 20,605 | 1,988 | 1,262 |
| Total Respondents | 719 | 295 | 40 |
| 2016 | 2017 | 2019 | 2021 | |
|---|---|---|---|---|
| Total Invites | 17,241 | 17,388 | 23,558 | 23,855 |
| Total Respondents | 1,366 | 1,089 | 1,695 | 1,054 |
| Percentage of respondents to invitations | 7.92% | 6.26% | 7.00% | 4.00% |
Scores ranged from 3.15 to 4.73 on a 5-point satisfaction scale.
Of the 26 departments:
| Students | Staff | Faculty | |
|---|---|---|---|
| Total Invitations | 21,159 | 1,963 | 1,333 |
| Total Respondents | 640 | 276 | 64 |
| 2016 | 2017 | 2019 | 2021 | 2022 | |
|---|---|---|---|---|---|
| Total Invites | 17,241 | 17,388 | 23,558 | 23,855 | 24,445 |
| Total Respondents | 1,366 | 1,089 | 1,695 | 1,054 | 960 |
| Percentage of respondents to invitations | 7.92% | 6.26% | 7.00% | 4.40% | 4.00% |
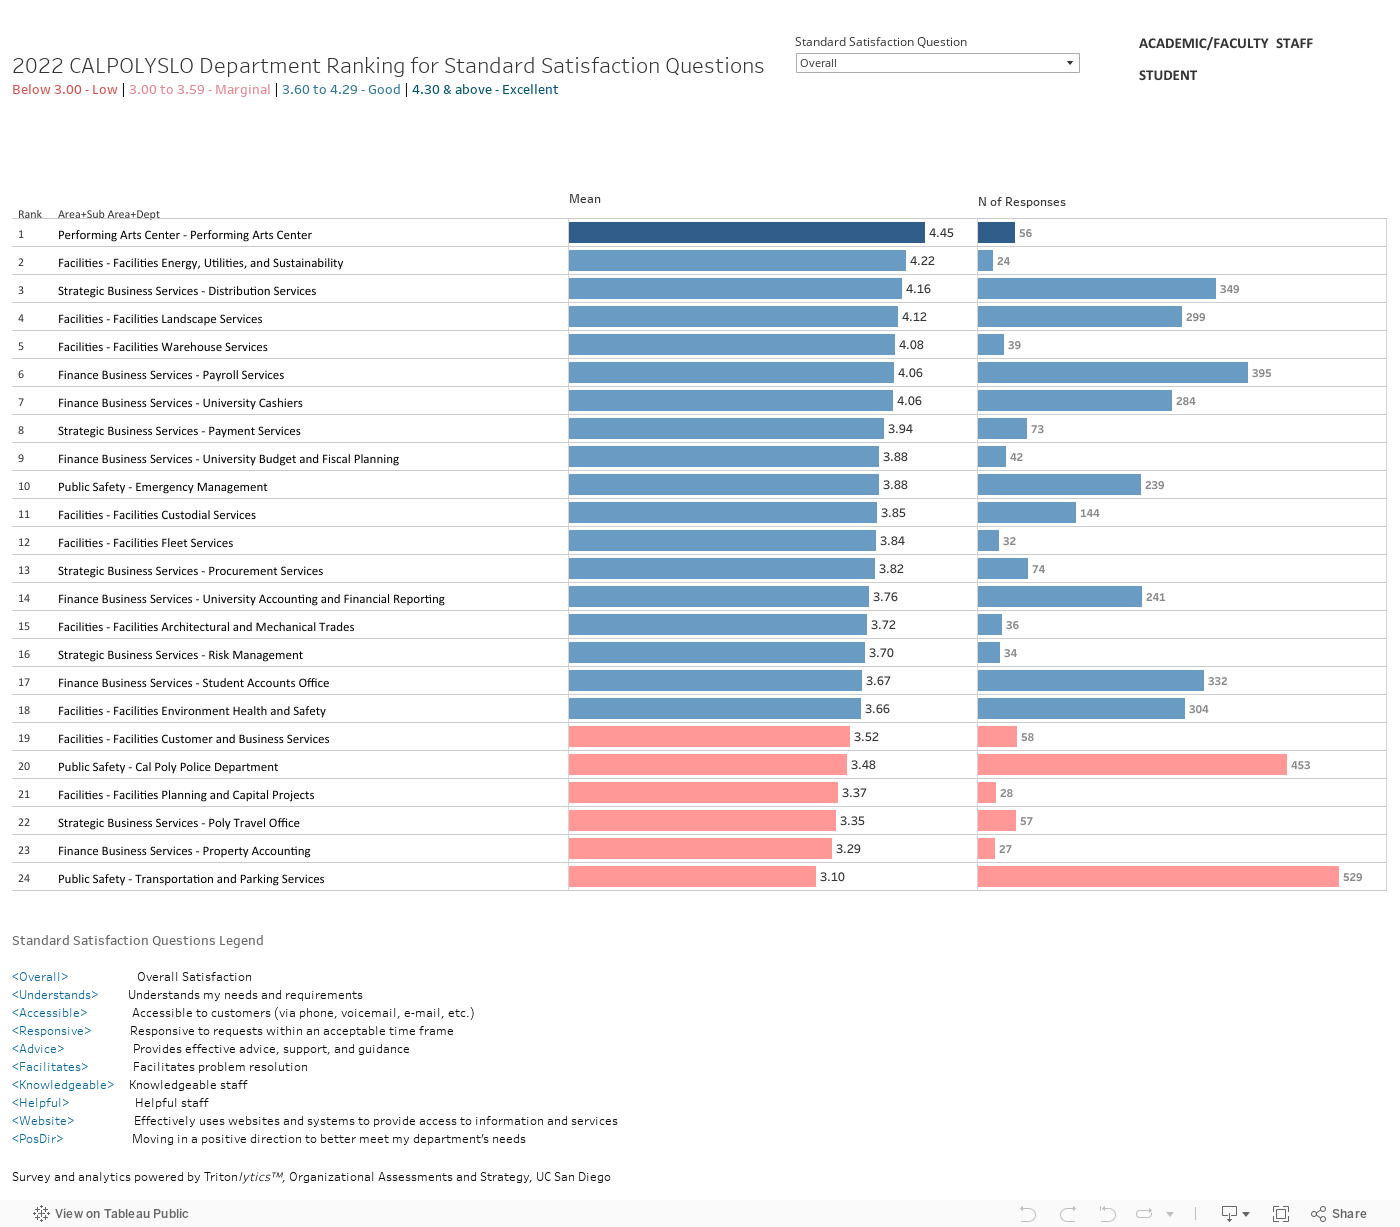
Scores ranged from 3.10 to 4.45 on a 5-point satisfaction scale.
Of the 24 departments:
| Students | Staff (incl. CPC/ASI) | Faculty | External Customers | |
|---|---|---|---|---|
| Total Invitations | 21,947 | 2,030 | 1,331 | 22 |
| Total Respondents | 627 | 245 | 53 | 4 |
| Trends – All History | 2016 | 2017 | 2019 | 2021 | 2022 | 2023 |
|---|---|---|---|---|---|---|
| Total Invites | 17,241 | 17,388 | 23,558 | 23,855 | 24,445 | 25,330 |
| Total Respondents (individuals) | 1,366 | 1,089 | 1,695 | 1,054 | 980 | 929 |
| Percentage of respondents to invitations | 7.92% | 6.26% | 7.00% | 4.40% | 4.00% | 4.00% |
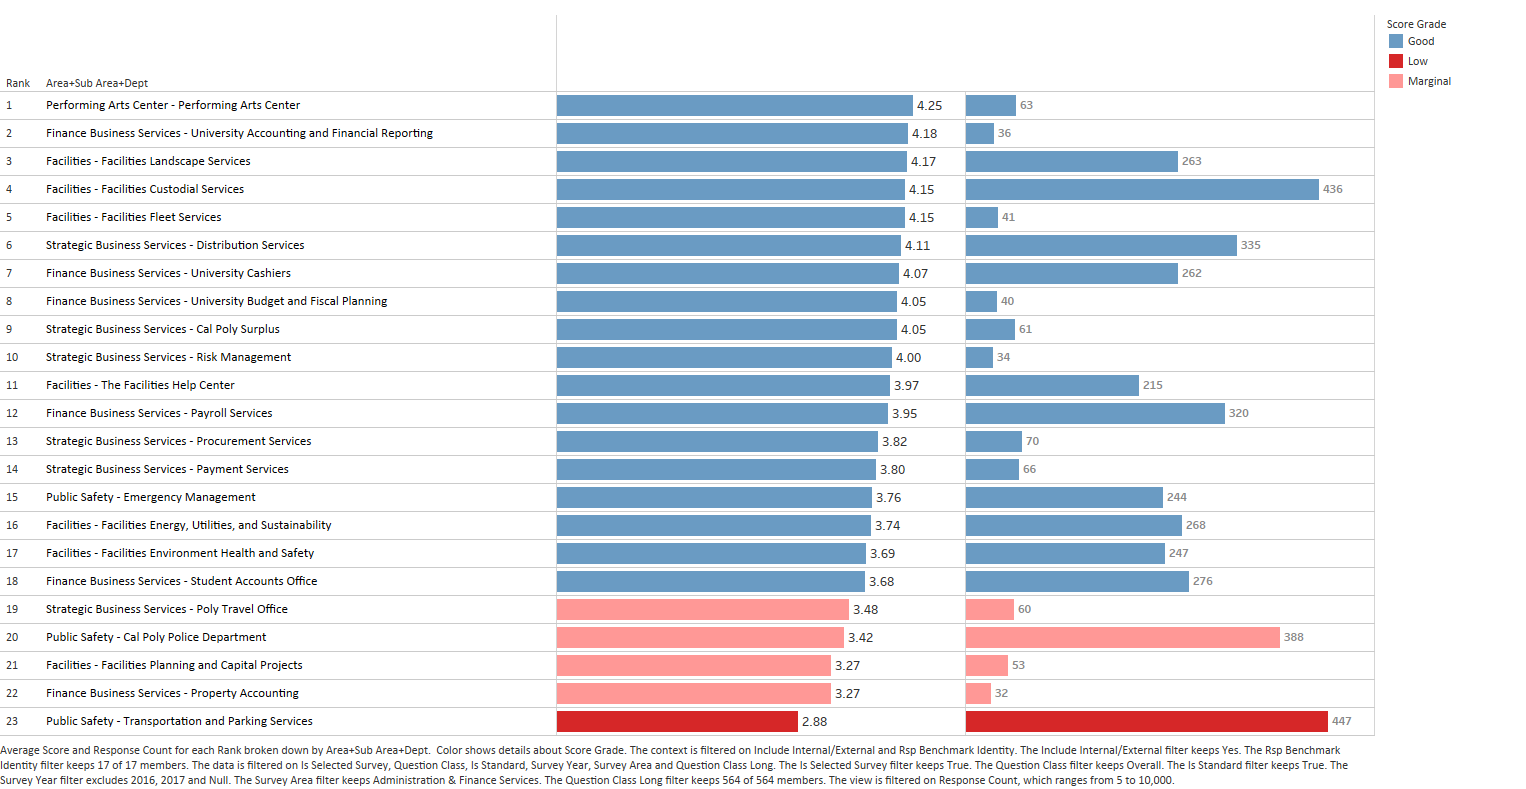
scores ranging from 2.88 to 4.25 on a 5-point satisfaction scale.
Of the 23 departments surveyed:
| Students | Staff (incl. CPC/ASI) | Faculty | |
|---|---|---|---|
| Total Invitations | 21,800 | 1,740 | 1,268 |
| Total Respondents | 824 | 358 | 65 |
| Trends – All History | 2016 | 2017 | 2019 | 2021 | 2022 | 2023 | 2024 |
|---|---|---|---|---|---|---|---|
| Total Invites | 17,241 | 17,388 | 23,558 | 23,855 | 24,445 | 25,330 | 26,055 |
| Total Respondents (individuals) | 1,366 | 1,089 | 1,695 | 1,054 | 980 | 929 | 1,247 |
| Percentage of respondents to invitations | 7.92% | 6.26% | 7.00% | 4.40% | 4.00% | 4.00% | 4.80% |
Scores ranging from 2.79 to 4.45 on a 5-point satisfaction scale.
Of the 23 departments surveyed: